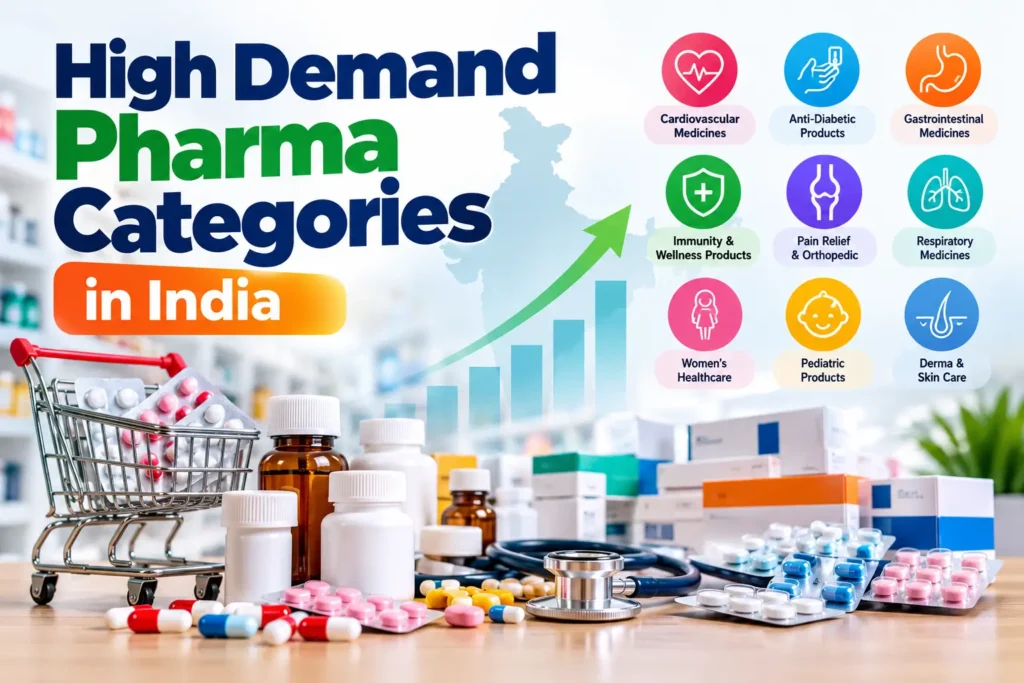
Choosing High demand pharma categories in India, In which therapeutic categories to focus on is one of the first and most consequential decisions for anyone planning to work with a PCD pharma franchise or a pharma distribution business in India. The wrong mix can leave a partner with slow-moving stock, thin margins and strained cash flow. The right mix depends on evidence, not on a single “best-seller” list.
Part of the difficulty is that “high demand” can mean several different things, and they are not interchangeable:
- High current sales: the categories that already account for the largest share of the market by value.
- Fast growth: the categories growing quickest in percentage terms, often from a smaller base.
- Large patient population: how many people live with a condition, which is not the same as how many medicines are sold.
- Recurring treatment: chronic therapies that generate repeat prescriptions, compared with acute or seasonal ones.
- Local prescribing and distribution demand: what doctors and chemists in one district actually prescribe and stock.
- Commercial suitability: whether a category fits a particular partner’s territory, capital, experience and product access.
These factors overlap, but a category can score well on one and poorly on another. This article reviews the latest published Indian market data for cardiovascular, diabetes, gastrointestinal, anti-infective, respiratory, dermatology, pain and musculoskeletal, nutritional and paediatric products, explains what each data point does and does not show, and sets out a practical framework for turning national trends into local decisions.
Data note: market figures below come from trade-media summaries of Pharmarack and IQVIA data and from a broker research note that uses IQVIA data. The underlying subscription reports were not accessed directly. Where sources use different methods, their numbers are shown separately and are not combined.
Overview of the Indian Pharmaceutical Market in 2026
The Indian Pharmaceutical Market (IPM) is the term data providers use for domestic pharmaceutical formulation sales that they track. Full-year 2026 figures are not available yet, so the table below separates reported historical data from forecasts. Every figure is a value or growth measure for India.
| Market Indicator | Latest Verified Figure | Reporting Period | What It Measures | Source |
|---|---|---|---|---|
| IPM annual turnover and growth | About ₹2.56 trillion; growth of 10.2% | Moving annual total (MAT), August 2025 to July 2026 | Value of domestic sales tracked by Pharmarack | Business Standard, 7 Aug 2026 |
| IPM monthly sales | ₹23,193 crore in July 2026, up 12.1% from ₹20,494 crore a year earlier | July 2026 | Monthly value, Pharmarack | Business Standard, 7 Aug 2026 |
| Latest monthly growth split | Value growth of about 13.5%, made up of roughly 3.4–3.5% volume, 6.2% price and 3.8% new products | September 2026 | Year-on-year monthly value growth and its drivers, Pharmarack | Business Standard, 8 Oct 2026 |
| Last full financial year | Value growth of about 10%, with roughly 2.7% volume, 4.4% price and 2.8% new-product contribution | FY26 (April 2025 to March 2026) | Value growth, IQVIA data as reported by HDFC Securities | HDFC Securities sector update, 15 Apr 2026 |
| Forecast (not a reported figure) | 2026 growth of 7.8–8.1% under a “realistic scenario” | Calendar year 2026, projected in January 2026 | Analyst projection of value growth, Pharmarack | BioSpectrum, 9 Jan 2026 |
Two points matter when reading this table. First, the January forecast is a projection, and monthly growth reported since then has been higher than that range; Business Standard notes that IPM value growth stayed in double digits through 2026 so far. Second, different providers produce different numbers for the same month. For March 2026, Pharmarack reported monthly growth of about 10.1% (Medical Dialogues), while the IQVIA-based note put it at 11%. Both are legitimate readings of different panels, which is why this article does not merge them.
Factors shaping the market in 2026 include price growth (a steady contributor), a recovery in volume growth that Pharmarack described as the highest in two years in September, the rapid arrival of generic semaglutide and other GLP-1 products, and rising attention to antimicrobial stewardship and medicine-quality enforcement.
Which Pharma Categories Have the Strongest Demand in India?
To keep comparisons fair, this article uses one comparable metric where possible: each therapy group’s share of IPM value and its value growth, as reported by IQVIA through HDFC Securities. It then adds the most recent 2026 Pharmarack data, sector reports and disease-burden evidence for context. Disease burden is treated as background only, because the number of people with a condition is not the same as the number of medicines sold.
| Therapy Group | Share of IPM Value (FY25) | Value Growth FY26 | Value Growth March 2026 |
|---|---|---|---|
| Cardiac | 13% | 14% | 15% |
| Anti-infectives | 11% | 5% | 2% |
| Gastrointestinal | 11% | 6% | 9% |
| Anti-diabetic | 9% | 12% | 14% |
| Respiratory | 8% | 12% | 7% |
| Pain / analgesics | 8% | 8% | 12% |
| Vitamins, minerals, nutrients | 8% | 10% | 13% |
| Dermatology | 7% | 7% | 9% |
| Neuro / CNS | 6% | 11% | 11% |
| Ophthalmology / otology | 2% | 9% | 11% |
Source: IQVIA data as presented in the HDFC Securities sector update of 15 April 2026. Share is for FY25 and growth is year-on-year value growth. Paediatrics is a patient group rather than a therapy group, so it does not appear as a line in this data.
Cardiovascular
Market evidence: Cardiac is the largest therapy group in both data sets. Pharmarack reported it at 14% of IPM value in July and September 2026, with sales of ₹3,299 crore in July and value growth of 14.7%. In September, cardiac volume grew 9.1%, and lipid-lowering drugs, platelet aggregation inhibitors, diuretics and heart-failure therapies each posted double-digit volume growth (Business Standard).
Demand drivers: A national ICMR-INDIAB study estimated hypertension prevalence at 35.5%, or about 315 million people, with 213 million reported to have high cholesterol (National Medical Journal of India). The survey ran from 2008 to 2020, and prevalence is not the same as treated patients or sales.
Products and formulations: Mostly oral long-term therapies such as antihypertensives, lipid-lowering agents and antiplatelets, usually tablets.
Franchise and distribution considerations: Repeat prescriptions can make stock planning more predictable, but this segment is dominated by large, well-established brands. Doctor relationships, consistent availability and price competitiveness matter more than category size.
Risks and limitations: A large disease burden does not guarantee franchise profitability. Prescriptions concentrate among established brands and specialists, and adherence and affordability affect how much is actually dispensed.
Diabetes and Other Metabolic Care
Market evidence: Anti-diabetic therapy was 9% of IPM value in FY25 and grew about 12% in FY26 (IQVIA). Pharmarack recorded sales of ₹2,237 crore in July 2026, up 17.6%. In September 2026, value growth of 16.1% came mainly from new products (9.5 percentage points) and price (5.6), with volume growth of only 1.0%, as new generic launches in GLP-1 drugs and combinations such as those containing empagliflozin drove the figure. GLP-1 agonist sales reached ₹1,906 crore on a moving annual basis in May 2026, against ₹565 crore a year earlier (Business Standard).
Demand drivers: ICMR-INDIAB estimated 11.4% diabetes prevalence, about 101 million people, and 136 million with prediabetes. An earlier INDIAB analysis cited in the same journal found combined control of key targets in fewer than 7% of people with self-reported diabetes, which points to unmet treatment need rather than guaranteed sales.
Products and formulations: Oral combinations, newer agents and injectables. Several of the fastest-growing molecules are prescribed mainly by specialists.
Franchise and distribution considerations: Long treatment durations favour repeat orders, but growth in this category is currently skewed towards new launches and price. Partners should check which molecules they can actually source and promote lawfully.
Risks and limitations: Heavy generic competition, rapid change in leading molecules and adherence challenges. Forecast growth of 10–11% for 2026 (Pharmarack) is a projection, not a result.
Gastroenterology
Market evidence: Gastrointestinal products were 11% of IPM value in FY25 (IQVIA, FY26 growth 6%). Pharmarack put the segment at about 12% of the market in July 2026, with sales of ₹2,820 crore and value growth of 9.2% (BioSpectrum). In May 2026, volumes were flat to slightly lower (−0.1%) despite 6.7% value growth.
Demand drivers: Acid-related complaints, infections and seasonal gastrointestinal illness. The sources reviewed give national sales evidence but no disease-prevalence figures, so none are quoted here.
Products and formulations: Tablets, capsules, suspensions and sachets, spanning prescription and OTC products.
Franchise and distribution considerations: A large category with high competition. Prescription and OTC status affects who you can promote to and how.
Risks and limitations: Value growth is being driven more by price than by volume. Pharmarack projected 4–7% growth for mature acute categories including gastrointestinal in 2026.
Anti-infectives
Market evidence: Anti-infectives were 11% of IPM value in FY25 but grew only about 5% in FY26 and 2% in March 2026 (IQVIA). Pharmarack reported 6.2% value growth in July 2026, and 5.8% in September, of which volume contributed only 0.3 percentage points.
Demand drivers: Infection burden, monsoon-related illness and prescribing patterns.
Products and formulations: Antibacterial tablets, capsules, dry syrups, injectables and topical products.
Franchise and distribution considerations: Antibiotics are prescription medicines. Under Schedule H1 of the Drugs and Cosmetics Act, selected antibiotics may be sold only against a prescription, with pharmacy records kept (ReAct). India launched its second National Action Plan on Antimicrobial Resistance for 2025–2029 on 18 November 2025 (Down To Earth).
Risks and limitations: A sales opportunity is never a reason to encourage antibiotic use. Overuse drives resistance, and stewardship norms are one reason Pharmarack expects slower growth here. Partners should promote only to qualified prescribers, follow Schedule H1 rules, and never suggest that antibiotics can be used without a prescription. For background on why this matters, see Rosette Pharma’s explainer on antibiotic resistance.
Respiratory Care
Market evidence: Respiratory products were 8% of IPM value in FY25 and grew about 12% in FY26 (IQVIA). Pharmarack reported volume growth of 10.0% in May 2026, the strongest among major therapies that month, and then a 6.9% volume fall in September as the monsoon receded, hitting anti-asthma, COPD and cough-and-cold products. Pharmarack expects demand to recover in November and December (Business Standard).
Demand drivers: Seasonal infections, allergies and chronic airway disease. National prevalence figures were not part of the sources reviewed.
Products and formulations: Tablets, syrups, drops and suspensions, plus inhaled products.
Franchise and distribution considerations: Strong seasonality means inventory timing matters. Over-buying before a seasonal peak that does not arrive leaves stock exposed.
Risks and limitations: Month-to-month swings make national numbers a weak guide to a single territory. Fixed-dose cough-and-cold products need particular care for children (see the paediatrics section).
Dermatology
Market evidence: Dermatology was 7% of IPM value in FY25, growing 7% in FY26 and 9% in March 2026 (IQVIA). A KPMG sector snapshot of January 2026 estimates the Indian dermatology market at over ₹16,000 crore, up from about ₹12,000 crore in 2021. It notes that medical dermatology (infections, eczema, psoriasis and similar) is growing at roughly 8–10% a year, while cosmetic dermatology is growing at 15–18% from a smaller base (KPMG in India).
Demand drivers: The same report cites rising skin-health awareness and a shift of some preventive skincare brands from prescription to OTC. Antifungals are a significant sub-segment, with itraconazole and luliconazole together holding more than half of it.
Products and formulations: Creams, ointments, gels, lotions, soaps, shampoos and oral antifungals. It is important to separate prescription dermatology medicines from cosmetics and personal-care products, which are regulated differently and are marketed differently.
Franchise and distribution considerations: KPMG reports that an estimated 25–30% of Indian dermatologists dispense directly, so trade schemes matter more here than in some other specialties. The category also has many established specialist players.
Risks and limitations: The largest sub-segment, anti-inflammatory (steroid-based) products, shows limited growth partly because of concerns about steroid misuse. KPMG also flags counterfeit and mislabelled skincare products as an industry problem.
Orthopaedics and Musculoskeletal Care
Market evidence: The public data does not break out orthopaedics as a separate line, so the closest proxy is pain and analgesics, which were 8% of IPM value in FY25, with FY26 growth of 8% and March 2026 growth of 12% (IQVIA). Pharmarack reported 11.4% value growth in July 2026, but in May 2026 volumes fell 1.7% despite 8.4% value growth.
Demand drivers: Everyday pain, inflammation, age-related joint problems and injury. No national musculoskeletal prevalence figure was verified for this article.
Products and formulations: Oral analgesics and anti-inflammatories, muscle relaxants, topical gels and ointments, and bone and joint nutrition products. Calcium, vitamin D and similar supplements are often counted under vitamins and minerals rather than pain.
Franchise and distribution considerations: Orthopaedic clinics and pharmacies are the main channels. Differentiated formulations tend to matter more than category size.
Risks and limitations: Pain products are widely used and heavily competed. Prescription analgesics must not be promoted for indiscriminate use, and category data is a proxy, not a direct orthopaedic figure.
Vitamins, Minerals and Nutritional Products
Market evidence: Vitamins, minerals and nutrients were 8% of IPM value in FY25 and grew about 10% in FY26 (IQVIA). Pharmarack recorded sales of ₹2,024 crore in May 2026 (value growth 12.5%, volume growth 5.9%) and value growth of 15.7% in July 2026.
Demand drivers: Health awareness and supportive therapy. Pharmarack’s 2026 outlook said nutritionals and dermatology would benefit from a shift beyond prescription channels towards self-care, e-pharmacies and modern trade.
Products and formulations: Multivitamins, calcium, iron, vitamin D, omega-3 and similar products, in tablets, capsules, softgels, syrups and drops.
Franchise and distribution considerations: This category sits in several regulatory buckets, including medicines, health supplements and other food-type products. Each product’s regulatory status, labelling and permitted claims must be checked individually.
Risks and limitations: Cardiac and anti-diabetic therapies are larger by value and should not automatically be ranked below nutritional products, or the reverse. Growth into OTC and online channels also increases competition for the PCD channel.
Paediatrics
Market evidence: Paediatrics is defined by the patient, not by the therapy, so the Pharmarack and IQVIA summaries reviewed give no standalone paediatric sales line. This article does not invent one. Paediatric demand has to be assessed through the underlying categories, such as respiratory, gastrointestinal, anti-infective and nutritional products, and through local prescribing.
Demand drivers: Seasonal infections, age-specific dosing needs and local demographics. Seasonal swings seen in respiratory and acute categories nationally (for example, the monsoon effect noted by Pharmarack) are not specific to children.
Products and formulations: Syrups, suspensions, oral drops, dry syrups for reconstitution, sachets and chewable or dispersible tablets. Correct strength, a measuring device and clear labelling are essential.
Franchise and distribution considerations: Supply quality is paramount. After child deaths linked to a contaminated cough syrup in 2025, the Directorate General of Health Services advised that cough and cold medicines should not be prescribed or dispensed to children under two, and are generally not recommended below five years (Morung Express/IANS). Partners should verify manufacturing source, excipient quality and batch testing for every liquid product.
Risks and limitations: Not every product is suitable for every age group, and these medicines are for use on a doctor’s advice, not for self-medication. Do not promote paediatric products for conditions or ages outside their approved labelling.
Other Categories Supported by Evidence
Three other groups have credible IQVIA evidence of growth. Neuro/CNS held 6% of IPM value in FY25 and grew 11% in FY26. Urology held about 2% and grew 11%. Ophthalmology and otology held about 2% and grew 9% in FY26. Anti-neoplastics grew about 24% in FY26 from a base of about 3% of IPM, but Pharmarack notes that most cancer drugs are sold through hospital rather than retail channels, so this category is less accessible to a typical PCD territory. Treat these as lines to research locally, not as established franchise opportunities.
Comparison of High-Demand Pharma Categories in India
How to read “evidence strength”: Strong means direct, recent Indian category sales or growth data from IQVIA or Pharmarack. Moderate means direct data exists but the category is only a rough proxy (for example, pain data standing in for orthopaedics). Indirect means the case rests on disease burden, regulation or qualitative factors rather than category sales data. This is not a ranking, and no scores are attached.
| Therapeutic Category | Evidence of Demand | Main Demand Drivers | Common Product/Formulation Types | Business Considerations | Evidence Strength |
|---|---|---|---|---|---|
| Cardiovascular | Largest therapy by value (13–14% of IPM); FY26 growth about 14% | Chronic disease burden, long-term treatment | Oral antihypertensives, lipid-lowering, antiplatelets | Repeat prescriptions; strong incumbent brands | Strong |
| Diabetes and metabolic | 9% of IPM; FY26 growth about 12% | High prevalence, new launches, GLP-1 generics | Oral combinations, injectables | Growth led by new products and price; specialist-driven molecules | Strong |
| Gastroenterology | 11–12% of IPM; FY26 growth about 6% | Acid-related and infective gut conditions | Tablets, capsules, suspensions, sachets | High competition; price-led growth | Strong |
| Anti-infectives | 11% of IPM; FY26 growth about 5% | Infection burden, seasonality | Antibacterial tablets, dry syrups, injectables | Prescription-only; stewardship and Schedule H1 compliance | Strong (sales); responsible-use limits apply |
| Respiratory | 8% of IPM; FY26 growth about 12%; volume swings with seasons | Seasonal infection, allergy, chronic airway disease | Tablets, syrups, drops, inhalers | Seasonal stock timing; paediatric safety cautions | Strong |
| Dermatology | 7% of IPM; KPMG estimates market above ₹16,000 crore | Skin conditions, awareness, OTC shift | Creams, ointments, gels, soaps, oral antifungals | Dispensing doctors; Rx versus cosmetic distinction | Strong |
| Orthopaedics and musculoskeletal | Proxy: pain/analgesics at 8% of IPM; FY26 growth about 8% | Everyday pain, ageing, injury | Oral analgesics, gels, muscle relaxants, bone nutrition | Crowded; responsible use; clinic-focused promotion | Moderate |
| Vitamins, minerals and nutrition | 8% of IPM; FY26 growth about 10% | Health awareness, supportive care, OTC shift | Multivitamins, calcium, iron, vitamin D, omega-3 | Mixed regulatory status; claims and labelling | Strong (category); mixed product types |
| Paediatrics | No standalone sales line in sources reviewed | Seasonal illness, age-specific dosing needs | Syrups, suspensions, drops, dry syrups, sachets | Safety, labelling and supply quality are critical | Indirect |
High Sales vs Fast Growth: Which Matters More?
The category with the highest current sales is not necessarily the fastest growing. The sources above show this clearly. Cardiac is the biggest therapy group, yet in the same period anti-neoplastics grew about 24% in FY26 and GLP-1 agonist sales roughly tripled in a year to ₹1,906 crore on a moving annual basis, while a much larger segment such as anti-diabetic therapy as a whole recorded monthly sales of ₹2,237 crore in July 2026. A fast-growing small category can add less in absolute rupees than a large category growing slowly.
Illustrative example (hypothetical numbers): Category A has annual sales of ₹1,000 crore and grows 5%, adding ₹50 crore. Category B has annual sales of ₹100 crore and grows 25%, adding ₹25 crore. Category B is growing five times faster, yet Category A still adds twice as much in absolute sales. Which one is better for a given franchise partner depends on access, competition and local demand.
Several other factors separate headline growth from a partner’s actual opportunity:
- Absolute size versus percentage growth: Percentage growth from a small base can look large without meaning large sales.
- Chronic versus acute treatment: Chronic categories such as cardiac and anti-diabetic tend to be steadier. Acute categories such as respiratory and gastrointestinal rise and fall with seasons. Pharmarack’s analysis of 2022–2026 data shows acute therapies responding more strongly to monsoon conditions than chronic ones.
- Price and volume: In September 2026 only part of IPM growth came from volume. Value growth that is mostly price or new launches is a different business from value growth that is mostly extra prescriptions.
- Regional differences: The ICMR-INDIAB study found large state-wise differences in diabetes and hypertension prevalence, so national averages can mislead.
- Prescriber preferences: A partner needs prescribers who will actually try new brands.
- Supply consistency and inventory: Fast-growing products can be harder to keep in stock, and slow-selling ones tie up cash.
- The actual territory: National trends are a starting point. A partner should always test them against local doctors, chemists and competing brands.
How to Select the Right Pharma Category for a PCD Franchise
No category is best for every partner. The right choice depends on the territory, the partner’s experience and resources, and which products the company can actually supply. A practical framework:
- Research local demand ethically and lawfully. Speak with doctors and chemists about what they prescribe and stock. Do not collect patient-identifiable information, offer inducements or breach applicable medicine-promotion rules such as the Uniform Code for Pharmaceutical Marketing Practices.
- Check product availability. Confirm which products are currently in the company’s catalogue and in stock, in writing.
- Verify licences and product documentation. Ask for the manufacturing and product documents that apply to each product and confirm your own licence requirements with your State Drug Control Department.
- Match dosage forms and therapeutic coverage to your customer base, for example syrups and drops for paediatric clinics, or topical products for dermatology practices.
- Study existing competition and pricing, including established brands in each category in your district.
- Estimate initial inventory and working capital. Build your own numbers rather than relying on a generic figure. Rosette Pharma’s guide on how to calculate working capital for a PCD pharma franchise walks through the method.
- Plan for expiry, batch traceability and stock rotation. Rotate stock on a first-expiry-first-out basis and review ageing stock regularly. See this guide on managing slow-moving medicine stock.
- Test distribution and delivery reliability with a small first order.
- Understand promotional resources and support, and whether they comply with advertising and medicine-promotion rules.
- Get territory terms in writing, including whether any exclusivity is offered, its scope and its conditions.
- Clarify payment cycles and customer credit. Longer credit periods tie up more cash.
- Review claims for compliance. Promotional claims should match approved labelling and applicable rules.
Why a Multi-Category Product Portfolio Can Matter
Evaluating a broader portfolio can help a partner in several ways:
- It allows assessment of several therapeutic segments before committing.
- It offers flexibility to align product selection with what local doctors prescribe.
- It may support relationships with a more varied set of pharmacies and distributors.
- It makes it possible to plan a balanced catalogue instead of depending on one segment or one season.
The trade-offs are real, too:
- Stock management becomes more complex.
- Different products may need different storage or handling.
- Inventory exposure rises if too many products are ordered at once.
- Regulatory and promotional requirements differ by category.
- A larger portfolio does not guarantee higher revenue.
No partner needs to stock every available category. A sensible approach is to begin with a focused selection that matches local demand and widen it once actual sales data is available.
Rosette Pharma’s Product Portfolio: Exploring Multiple Therapeutic Categories
Rosette Pharma describes itself as a pharma company established in 2006 and based in Karnal, Haryana, offering PCD pharma franchise opportunities across India as well as third-party manufacturing. Its homepage states that its portfolio includes 500+ formulations across major therapeutic segments, and it lists twelve product-form categories: tablets, capsules, dry syrup, injectables, ointment, softgel capsules, syrup, skin and haircare, drops and suspension, sachet, ear, eye and nasal drops, and dental. These are company-stated figures, reviewed on the live website on 19 October 2026, and they have not been independently audited.
The company organises its range into divisions. Its Rosette Pharmaceuticals product list covers allopathic products, including antibacterial, gastrointestinal, pain, antidiabetic, cardiovascular, respiratory and nutritional lines. The Admetus Pharma division focuses on dermatology, derma-cosmetics and orthopaedic-related products. Yeux Care covers eye drops, and the site also lists a drops and suspension category that is relevant to paediatric formulations.
A portfolio that spans several dosage forms and categories can help prospective partners compare options for their target market. It does not mean every category is equally in demand, that every product is always available, or that every partner should carry the entire catalogue. Product availability, licences and documentation for any specific product should be confirmed with the company in writing before ordering.
Readers who would like to compare the range against their own territory can review the company’s product divisions and ask which items are currently available for their area.
Mistakes to Avoid When Choosing High-Demand Pharma Products
- Choosing products only because they are nationally popular. National rankings say little about one district.
- Treating disease prevalence as proof of sales. A condition can be common and still produce few sales in your territory.
- Following a growth trend without checking local demand. Fast growth from a small base may not reach your market.
- Over-ordering before validating the market. Start small and reorder from sales data.
- Ignoring expiry dates and stock rotation. Expiry losses reduce margins directly.
- Choosing a company without checking documentation. Use a structured checklist, such as this guide to checking a pharma franchise company before you commit.
- Assuming a large catalogue guarantees profitability. Range is not revenue.
- Promoting medicines with unsupported claims. Claims must match approved labelling.
- Ignoring prescription status and responsible use. This applies especially to antibiotics, steroids and paediatric products.
- Failing to compare price, competition and supply reliability. Margin on paper means little if stock is unavailable or heavily discounted.
Frequently Asked Questions
1. Which pharma categories have high demand in India in 2026?
By value, cardiac, gastrointestinal, anti-infective and anti-diabetic therapies are the largest groups. Pharmarack reported that four leading therapies together accounted for 46.6% of the market in July 2026. Respiratory, pain, vitamins and minerals, and dermatology follow. Rankings vary by data provider, period and region, so treat them as a guide and not as a fixed list.
2. Which therapeutic segments are growing fastest in India?
Among sizeable groups, anti-diabetic therapy grew about 16–18% in value in recent Pharmarack data, partly because of new launches, with cardiac and vitamins and minerals also growing at double-digit rates. Anti-neoplastics grew faster still but from a small base and mainly through hospitals. Growth rates differ by provider and period, and value growth includes price and new products, not just volume.
3. Are dermatology and cardiovascular products major pharma categories?
Yes. Cardiac is the largest therapy group by value (13–14% of the market), and dermatology accounts for about 7%, with KPMG estimating the dermatology market at more than ₹16,000 crore. Both are large, but they are also competitive, and neither guarantees profitability for a particular franchise partner.
4. Is paediatrics a suitable category for a pharma franchise?
It can be, depending on the territory, but the available national data does not give a separate paediatric sales figure, so demand must be judged locally. Safety, correct formulations, labelling and supply quality are essential, and national advisories restrict cough and cold medicines in young children.
5. How can I identify demand for pharma products in my local area?
Speak with local doctors and chemists about what they prescribe and stock, observe competing brands, review seasonal patterns and start with a small trial order. Do this lawfully, without collecting patient-identifiable data or offering inducements.
6. Is a multi-category pharma portfolio better than focusing on one category?
Neither is better in every case. A broader portfolio gives flexibility and balance but increases stock complexity and inventory exposure. Many partners begin with a focused range and expand as data accumulates.
7. What should I check before selecting products for a PCD pharma franchise?
Check local demand, competition, pricing, product availability, manufacturing and product documentation, dosage forms, licences, expiry policies, payment terms and territory terms. Get important terms in writing.
8. How do market growth and actual sales demand differ?
Market growth is a percentage change in sales value, which can come from price, new products or volume. Actual sales demand in your territory depends on how many prescriptions doctors write and how many packs chemists sell. For example, Pharmarack found September 2026 growth in anti-diabetics was driven far more by new products and price than by volume.
9. How can a pharma franchise partner evaluate a company’s product range?
Compare the range against local needs, ask for current availability and documentation, request samples, check labelling and batch information, and run a small first order before scaling.
10. How can I explore Rosette Pharma’s portfolio and franchise opportunities?
Review the product divisions and catalogue pages named above, then contact the team through the Rosette Pharma website to ask which products are available for your district and to request current terms in writing.
Conclusion
The latest published data shows a large, growing Indian pharmaceutical market in which chronic categories such as cardiac and anti-diabetic therapies lead on size and growth, while gastrointestinal, anti-infective, respiratory, pain, nutritional and dermatology products make up much of the rest. The evidence also shows why a headline ranking is not enough: value growth is often price- and launch-led, seasonal categories swing sharply, anti-infectives are constrained by stewardship, and paediatrics cannot be measured as a single sales line.
For a franchise partner, the practical conclusion is to combine national category data with local demand, competition, product documentation, supply reliability, inventory exposure and available capital. Rosette Pharma’s company-stated multi-category portfolio may help partners compare options, but each product still needs to be checked against local needs. To discuss territory availability or product options, you can contact the Rosette Pharma team.
This article is for general business and educational information. It is not medical, legal, tax or financial advice. Medicines should be used only on professional advice and in line with approved labelling.